![]() https://doi.org/10.35845/kmuj.2023.23439 ORIGINAL
ARTICLE
https://doi.org/10.35845/kmuj.2023.23439 ORIGINAL
ARTICLE
A modified equation for calculating low density lipoprotein cholesterol in Pakistani population
Amjad Nawaz 1, Madeeha Khan 1, Quratul Ain 1,2, Hijab Batool 3,
Muhammad Dilawar Khan 3,
Mohammad Iqbal Khan 4,5, Fouzia Sadiq 1 ![]()
|
1: Directorate of Research, Shifa Tameer-e-Millat University, Pitras Bukhari Road, H-8/4, Islamabad 44000, Pakistan 2: Translational Genomics Laboratory, Department of Biosciences, COMSATS University, Islamabad 44000, Pakistan 3: Chemical Pathology, Chughtai Institute of Pathology, Lahore, Pakistan 4: Shifa Tameer-e-Millat University, Pitras Bukhari Road, H-8/4, Islamabad 44000, Pakistan 5: Department of Vascular Surgery, Shifa International Hospital Pitras Bukhari Road, H-8/4, Islamabad 44000, Pakistan
Email Contact #: +92-51-8493038
Date Submitted: August 08, 2023 Date Revised: November 30, 2023 Date Accepted: December 23, 2023 |
|
THIS ARTICLE MAY BE CITED AS: Nawaz A, Khan M, Ain Q, Batool H, Khan MD, Khan MI, Sadiq F. A modified equation for calculating low density lipoprotein cholesterol in Pakistani population. Khyber Med Univ J 2023;15(4):223-8. https://doi.org/10.35845/kmuj.2023.23439 |
ABSTRACT
OBJECTIVE: To derive an equation for accurate estimation of low-density lipoprotein cholesterol (LDL-C) in the Pakistani population.
METHODS: A modified equation was derived on the dataset (n = 59,148) from the Pakistani population, comprising directly measured LDL-C (dLDL-C) and other lipids using a regression model. The equation was validated on an internal (n = 29,633) and external dataset (n = 385,434), and the results were compared with the standard equations being used in the Pakistani population: Friedewald and Teerakanchana equation. The concordance between the dLDL-C and calculated LDL-C (cLDL-C) was determined by median difference (MD) and the agreement between dLDL-C and cLDL-C was analyzed by Bland Altman graphics.
RESULTS: The modified equation (M.Eq) displayed best correlation (r = 0.974) and MD of -0.07 mmol/L on the derivation dataset. Similarly, the equation provided the best correlation and least MD on the internal (r = 0.970, MD = -0.13) and external validation datasets (r = 0.953, MD = -0.02). The Bland-Altman plot for the modified equation displayed the least bias in the derivation (-0.0012 mmol/L), internal validation (-0.13 mmol/L), and external validation (-0.02 mmol/L)
CONCLUSION: The modified equation can be utilized for clinical settings in Pakistan that do not facilitate direct measurements of LDL-C.
KEYWORDS: Cardiovascular Diseases (MeSH); Lipoproteins, LDL (MeSH); Cholesterol (MeSH); Triglycerides (MeSH); Analysis (Non-MeSH); Modified equation (Non-MeSH); Friedewald (Non-MeSH); Teerakanchana (Non-MeSH); Bland Altman (Non-MeSH)
INTRODUCTION
Evidence from several epidemiological and Mendelian randomization studies establishes the fact that LDL-C is the major biomarker and causal risk factor for the development of atherosclerotic cardiovascular disease (ASCVD).1,2 LDL-C has been recognized as a target for the initiation or adjustment of lipid-lowering interventions; hence, accurate measurement of LDL-C is crucial.3 The reference gold standard method for measuring LDL-C is β quantification, which involves the separation of lipoproteins by ultracentrifugation; however, this technique could be laborious, time-consuming, and expensive.4 Alternatively, fully automated homogeneous assays are also utilized for accurate LDL-C measurement; however, their cost remains a challenge.5 Clinical laboratories particularly those in the developing countries routinely calculate LDL-C with the help of equations, based on the lipid profile panel.6
Friedewald equation is the most widely and frequently used equation for the calculation of LDL-C, however the accuracy of Friedewald equation compared to direct measurement methods could be influenced by high triglyceride (TG) levels.5,7,8 The equation proposed by Sampson and colleagues can provide accurate estimation of LDL-C at TG levels as high as 9.0 mmol/L.9 Several other equations proposed over the years have been validated for different populations; however, most of these are not routinely employed for calculating LDL-C.9–19 Previously, it was demonstrated that the Teerakanchana equation provided better accuracy for calculating LDL-C in Pakistani and Indian populations compared to other equations. 20,21
METHODS
The study was approved by Institutional Review board and Ethics Committee (IRB&EC), Shifa Tameer-e-Millat University, Islamabad, Pakistan (IRB # 0194-22). Two anonymized lipid profile datasets including direct LDL-C (dLDL-C), high-density lipoprotein (HDL-C), Triglycerides (TG) and total cholesterol (TC) of 59,148 (from January 2019- March 2022) and 29,633 (from April 2022- May 2023) outpatients, were obtained from Shifa International Hospital, Islamabad. The first dataset was employed as derivation dataset while the second dataset was used as an internal validation dataset. The dLDL-C and lipid profile was measured by a homogenous enzymatic method (Cobas 8000 c502 module, Roche, USA). The new equation was also validated on external datasets. For the external validation dataset, lipid profile data of 385,434 individuals (from January 2021-December 2022) was obtained from Chughtai Laboratories, Lahore,P measured on Abbott Alinity ci analyser. The data from Chughtai Laboratories covered the population of the entire country.
We developed a modified equation (M.Eq) for LDL-C calculation using multiple linear regression model. The modified equation was developed based on the Friedewald equation. For the derivation of the equation, cLDL-C was taken as the dependent variable and TG, TC and HDL were independent variables in the regression equation y= a +b1(x1) +b2(x2) +b3(x3) +ei. The best fitted regression line was obtained using the method of least square by minimizing the sum of square of residuals in the estimation of cLDL-C, y= a +b1(x1) +b2(x2) +b3(x3). This equation was utilized for our data cLDL-C=a +b1 (TC) +b2 (HDL) + b3 (TG). Getting the values of (b1, b2, b3) from best fitted regression equation and presented the modified formula to estimate the cLDL-C values as;
M.Eq cLDL-C=0.920 (TC)-0.763 (HDL)-0.117 (TG) + 5.445
According to the above modified formula total cholesterol had the maximum contribution. The newly derived equation was validated on an internal and external dataset and compared with the Friedewald and Teerakanchana equations;
Friedewald cLDL-c= TC – HDL − (TG / 2.2)
Teerakanchana cLDL-C= = 0.910×TC − 0.634×HDL-C − 0.111×TG − 6.755
Statistical analysis was performed by using SPSS version 27 and Python v 3. 10.7. The normality of the study variables was checked by Kolmogorov-Smirnov test. Since the data was not normally distributed, the values are presented as median and IQR. The Wilcoxon sign rank test was used to check the difference between dLDL-c and cLDL-c calculated by different equations. The Spearman rank correlation between the different methods was analyzed and the level of significance was fixed at 5%. The agreement between dLDL-c and cLDL-c was analysed by Bland Altman and plotted where differences between the dLDL-C and cLDL-C on the y-axis and means on the x-axis.
RESULTS
The distributional characteristics of the datasets used for this study are given in Table I.
Table I: Distributional characteristics of the study population
|
Dataset |
Parameters |
Minimum (mmol/L) |
Maximum (mmol/L) |
Median (mmol/L) |
IQR (mmol/L) |
|
Derivation dataset (n=59,148) |
TC |
0.83 |
31.65 |
3.98 |
4.96-2.56 |
|
TG |
0.29 |
80.93 |
1.35 |
2.14-1.10 |
|
|
HDL-C |
0.08 |
3.41 |
1.06 |
1.13-0.95 |
|
|
Internal validation dataset (n=29,633) |
TC |
0.47 |
27.31 |
4.55 |
5.32-3.80 |
|
TG |
0.14 |
61.50 |
1.72 |
2.47-2.14 |
|
|
HDL-C |
0.16 |
4.22 |
1.06 |
1.24-0.90 |
|
|
External validation dataset (n=385,434) |
TC |
0.72 |
25.47 |
4.76 |
5.51-4.01 |
|
TG |
0.08 |
86.93 |
1.76 |
2.50-1.28 |
|
|
HDL-C |
0.13 |
7.14 |
1.01 |
1.16-0.85 |
|
|
IQR- Interquartile range, TC- Total cholesterol, TG- Triglycerides, HDL-C- High-density lipoprotein cholesterol |
|||||
The median differences of M.Eq, Friedewald, Teerakanchana equations compared to dLDL-C on derivation data set (-0.07, 0.38, 0.12 mmol/L), internal validation (-0.13, 0.28, 0.06 mmol/L) and external validation datasets (-0.02, 0.37, 0.18 mmol/L), respectively. The cLDL-C from all the equations was significantly different from dLDL-C (P<0.005). The results also suggested that M.Eq provided good rank correlation with dLDL-C on the derivation (r = 0.974), internal validation (r = 0.970) and external validation (r = 0.953) datasets (Table II).
Table II: Median, IQR, median difference values of calculated LDL-C by the equations on the three data sets (derivation, internal validation, and external validation)
|
Parameters |
Derivation (n=59,148) |
Internal Validation (n=29,633) |
External Validation (n=385,434) |
||||||
|
Median (IQR) (mmol/L) |
Median Difference (mmol/L) |
Correlation (r) |
Median (IQR) (mmol/L) |
Median Difference (mmol/L) |
Correlation (r) |
Median (IQR) (mmol/L) |
Median Difference (mmol/L) |
Correlation (r) |
|
|
dLDL-C |
2.43 (1.42-3.33) |
- |
- |
2.81 (2.14-3.49) |
- |
- |
3.15 (2.43-3.85) |
- |
- |
|
M.Eq cLDL-C |
2.50 (1.39-3.31) |
-0.07 |
0.974 |
2.94 (2.31-3.57) |
-0.13 |
0.970 |
3.17 (2.54-3.79) |
-0.02 |
0.953 |
|
Friedewald cLDL-C |
2.05 (0.99-2.91) |
0.38 |
0.963 |
2.53 (1.84-3.21) |
0.28 |
0.956 |
2.78 (2.11-3.44) |
0.37 |
0.902 |
|
Teerakanchana cLDL-C |
2.31 (1.20-3.11) |
0.12 |
0.973 |
2.75 (2.12-3.38) |
0.06 |
0.969 |
2.97 (2.34-3.59) |
0.18 |
0.940 |
|
IQR- Interquartile range, dLDL-C- direct low-density lipoprotein cholesterol, M.Eq cLDL-C- Modified equation calculated low-density lipoprotein cholesterol, cLDL-C- calculated low-density lipoprotein cholesterol |
|||||||||
M.Eq had a minimum median difference for all TG ranges on the derivation and validation data set. For TG range <1.64(mmol/L), M.Eq showed the best Spearman rank correlation with dLDL-C on derivation, internal validation, external validation (r=0.974, r=0.984, r=0.953). For TGs ranged between 1.69-2.24 mmol/L, M.Eq provided the best correlation on derivation (r=0.967) and external validation data sets (r=0.963). Friedewald equation showed good correlation for TG >5.64 mmol/L on derivation (r=0.813), internal (r=0.800) and external validation dataset (r=0.820), however it displayed a large median differences as compared to M.Eq and Teerakanchana equation (Table III).
Table III: Median, median difference and correlation values of calculated LDL-C by the equations on the three data sets (derivation, internal validation, and external validation) at TG stratifications
|
TG Levels (mmol/L) |
Median (IQR) |
Median Difference |
Correlation (r) |
Median (IQR) |
Median Difference |
Correlation (r) |
Median (IQR) |
Median Difference |
Correlation (r) |
|
TG<1.64 |
Derivation (n=36,571) |
Internal Validation (n=14,328) |
External validation (n=178,805) |
||||||
|
dLDL-C |
2.43 (1.42-3.33) |
- |
- |
2.81 (2.14-3.49) |
-
|
- |
3.15 (2.43-3.85) |
- |
- |
|
M.Eq |
2.50 (1.39-3.31) |
-0.07 |
0.974 |
2.94 (2.31-3.57) |
-0.13 |
0.984 |
3.17 (2.54-3.79 |
-0.02 |
0.953 |
|
Friedewald |
2.05 (0.99-2.91) |
0.38 |
0.963 |
2.53 (1.84-3.21) |
0.28 |
0.982 |
2.78 (2.11-3.44) |
0.37 |
0.902 |
|
Teerakanchana |
2.31 (1.20-3.11) |
0.12 |
0.973 |
2.75 (2.12-3.38) |
0.06 |
0.981 |
2.97 (2.34-3.59) |
0.18 |
0.940 |
|
TG 1.69-2.24 |
Derivation (n=9,061) |
Internal Validation (n=6,140) |
External validation (n=83,907) |
||||||
|
dLDL-C |
3.10 (2.43-3.75) |
- |
- |
2.97 (2.27-3.64) |
- |
- |
3.34 (2.61-4.03_ |
- |
- |
|
M.Eq |
3.07 (2.48-3.67) |
0.03 |
0.967 |
3.08 (2.44-3.71) |
-0.11 |
0.979 |
3.30 (2.27-3.90) |
0.04 |
0.963 |
|
Friedewald |
2.69 (2.05-3.34) |
0.41 |
0.967 |
2.69 (2.00-3.36) |
0.28 |
0.979 |
2.94 (2.27-3.60) |
0.40 |
0.961 |
|
Teerakanchana |
2.87 (2.28-3.47) |
0.23 |
0.967 |
2.83 (2.24-3.50) |
0.14 |
0.980 |
3.09 (2.47-3.70) |
0.25 |
0.962 |
|
TG 2.25-5.64 |
Derivation (n=12,527) |
Internal Validation (n=8,323) |
External validation (n=112,427) |
||||||
|
dLDL-C |
3.18 (2.48-3.87) |
- |
- |
3.05 (2.35-3.74) |
-
|
- |
3.34 (2.64-4.03) |
- |
- |
|
M.Eq |
3.15 (2.51-3.79) |
0.03 |
0.955 |
3.15 (2.49-3.82) |
-0.10
|
0.963 |
3.38 (2.57-4.02) |
-0.04 |
0.940 |
|
Friedewald |
2.60 (1.90-3.29) |
0.58 |
0.948 |
2.59 (1.87-3.32) |
0.46
|
0.957 |
2.85 (2.16-3.55) |
0.49 |
0.938 |
|
Teerakanchana |
2.95 (2.32-3.59) |
0.23 |
0.955 |
2.95 (2.30-3.62) |
0.10
|
0.963 |
3.18 (2.55-3.81) |
0.16 |
0.940 |
|
IQR- Interquartile range, dLDL-C- direct low-density lipoprotein cholesterol, M.Eq cLDL-C- Modified equation calculated low-density lipoprotein cholesterol, cLDL-C- calculated low-density lipoprotein cholesterol |
|||||||||
The Bland Altman plots for the comparison of dLDL-C and cLDL-C showed that M.Eq had the least estimated bias in the derivation (-0.0012), internal validation (-0.13mmol/L) and external validation (-0.02 mmol/L) at 95 % of limit of agreement (Figure 1). When compared with other equations, M.Eq had the least mean bias on derivation and validation datasets (Figure 1).
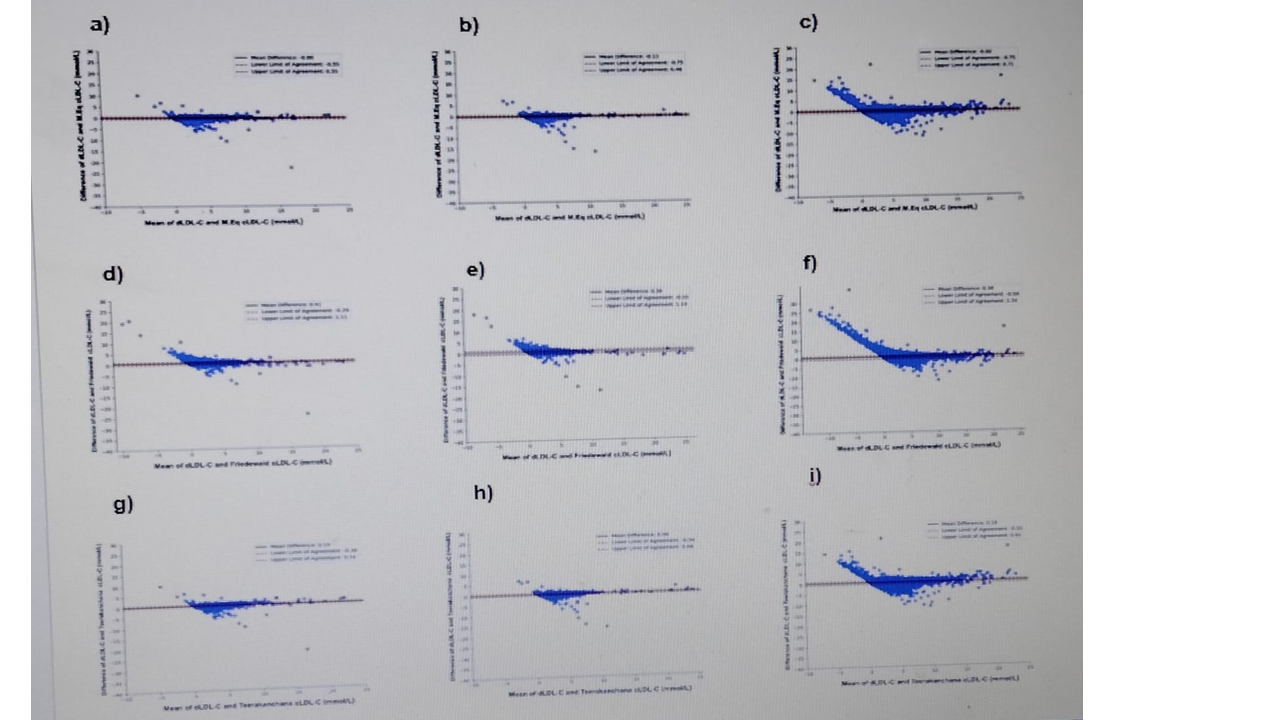
Figure 1: Bland-Altman plots between dLDL and cLDL-C for the M.Eq (a,b,c) (a) derivation dataset (n= 59,148); b) internal validation datase(n=29,633) and c) external validation dataset (n= 385,434); Teerakanchana equation (d,e,f) (d) derivation dataset (n= 59,148); e) internal validation dataset (n=29,633) and f) external validation dataset (n= 385,434) and Friedewald equation (g,h,i) (g) derivation dataset (n= 59,148); h) internal validation dataset (n=29,633) and i) external validation datase n= 385,434). The solid line shows mean difference and the dotted lines show the limit of agreement between dLDLC-C and cLDL-C. Abbreviations: dLDL-C- direct LDL-C, M.Eq cLDL-C- Modified equation calculated LDL
DISCUSSION
The present study aimed to derive a modified equation for estimating LDL-C in Pakistani population. The equation was derived using the least square regression model on a dataset of 59,148 individuals and compared to dLDL-C measured by homogeneous assays. The validity of the equation was determined on a dataset (n=29,633) from the same laboratory and analyser, while further validation was determined on data from external laboratory (n=385,434) using a different analyser. The results of the study showed that the M.Eq provided least median difference and good rank correlation with dLDL-C. . The Bland Altman plots displayed a higher degree of concordance with the dLDL-C. Friedewald equation is the most commonly used equation utilized by clinical diagnostic laboratories all over Pakistan for estimating LDL-C. The results from the studies conducted in Pakistan for determining its validity shows moderate correlation or misclassifications due to underestimation or overestimation of LDL-C.20,23 Several other modified equations have been derived over the years but most of them were not validated in large populations. The equation developed by Martin and colleagues focuses on the interindividual variance and relies on a novel factor for each individual and has been recommended for use by the American Heart Association Guidelines, however it might not perform well for higher TG levels.24,25 The efficiency of Sampson equation in calculating LDL-C even at high TG levels have been validated in several studies.26-28 However, it did not perform well on Pakistani population compared to other equations.20 Recently the Teerakanchana equation that was derived on the Thai population outperformed other equations for calculating LDL-C in Pakistani population.20 Moreover, other equations developed based on South Asian population are either not validated on large datasets or are not well known.29,30 However, no equation has been derived specifically for Pakistani population, keeping in view heterogeneity in the population.
The Friedewald equation is widely employed in routine clinical settings across the country, however as previously mentioned it can lead to misclassification particularly at high TG levels. This was also observed in the present study where Friedewald equation despite a stronger correlation resulted in a high median difference at TG above 5.64 mmol/L, however the modified and Teerakanchana equations despite weaker correlation provided least median difference compared to Friedewald equation. Overall, the modified equation outperformed other equations presented in the study. The LDL-C levels are influenced by race and ethnicity.31 The greatest strength of the modified equation presented in this study was derived and validated on a large dataset from Pakistan. Moreover, this equation can be automatically calculated by the information systems available at the laboratories without additional needs of software up gradation and maintenance.
One of the major limitations of this study is that this equation was derived and validated based on dLDL-C measured by direct homogeneous assays, instead of the recommended gold standard method of beta quantification. To the best of our knowledge, this method is not utilized anywhere in Pakistan mostly due to economic constraints. Moreover, this equation is based on fixed factors, so it does not take inter individual variance into account. The data on other clinical parameters, metabolic status or therapy of the included population were not known, therefore the impact of these factors on lipid levels was not known. Finally, this equation was derived and validated on data from the Pakistani population, the performance in other populations needs further validation.
CONCLUSION
We derived and validated a modified equation named as for LDL-C estimation based on the lipid profile in Pakistani population, which can be easily implemented without any additional costs. This equation can be utilized for clinical settings where no opportunities for direct assays are available. However, the external validation of this equation is required to assess its clinical use and implementation.
ACKNOWLEDGEMENTS
We acknowledge Management Information Services, Shifa International Hospital, Islamabad and Chughtai Laboratories Ltd. for facilitation in data acquisition.
1. Ference BA, Ginsberg HN, Graham I, Ray KK, Packard CJ, Bruckert E, et al. Low-density lipoproteins cause atherosclerotic cardiovascular disease. Evidence from genetic, epidemiologic, and clinical studies. A consensus statement from the European Atherosclerosis Society Consensus Panel. Eur Heart J 2017;38(32):2459-72. https://doi.org/10.1093/eurheartj/ehx144
2. Borén J, John Chapman M, Krauss RM, Packard CJ, Bentzon JF, Binder CJ, et al. Low-density lipoproteins cause atherosclerotic cardiovascular disease: Pathophysiological, genetic, and therapeutic insights: A consensus statement from the European Atherosclerosis Society Consensus Panel. Eur Heart J 2020;41:2313-30. https://doi.org/10.1093/eurheartj/ehz962
3. Wadhera RK, Steen DL, Khan I, Giugliano RP, Foody JM. A review of low-density lipoprotein cholesterol, treatment strategies, and its impact on cardiovascular disease morbidity and mortality. J Clin Lipidol 2016;10:472-89. https://doi.org/10.1016/j.jacl.2015.11.010
4. Nauck M, Warnick GR, Rifai N. Methods for Measurement of LDL-Cholesterol: A Critical Assessment of Direct Measurement by Homogeneous Assays versus Calculation. Clin Chem 2002;48: 236-54.
5. Brownstein AJ, Martin SS. More accurate LDL-C calculation: Externally validated, guideline endorsed. Clin Chim Acta 2020;506:149-53. https://doi.org/10.1016/j.cca.2020.03.030
6. Karkhaneh A, Bagherieh M, Sadeghi S, Kheirollahi A. Evaluation of eight formulas for LDL-C estimation in Iranian subjects with different metabolic health statuses. Lipids Health Dis 2019;18(1):231. https://doi.org/10.1186/s12944-019-1178-1
7. Wolska A, Remaley AT. Measuring LDL-cholesterol: what is the best way to do it? Curr Opin Cardiol 2020;35(4):405-11. https://doi.org/10.1097/hco.0000000000000740
8. Friedewald WT, Levy RI, Fredrickson DS. Estimation of the Concentration of Low-Density Lipoprotein Cholesterol in Plasma, Without Use of the Preparative Ultracentrifuge. Clin Chem 1972;18:499-502.
9. Sampson M, Ling C, Sun Q, Harb R, Ashmaig M, Warnick R, et al. A New Equation for Calculation of Low-Density Lipoprotein Cholesterol in Patients with Normolipidemia and/or Hypertriglyceridemia. JAMA Cardiol 2020;5(5):540-8. https://doi.org/10.1001/jamacardio.2020.0013
10. Delong DM, Delong ER, Wood PD, Lippel K, Rifkind BM. A Comparison of Methods for the Estimation of Plasma Low- and Very Low-Density Lipoprotein Cholesterol: The Lipid Research Clinics Prevalence Study. JAMA 1986;256(17):2372-7.
11. Rao A, Parker AH, el-Sheroni NA, Babelly MM. Calculation of low-density lipoprotein cholesterol with use of triglyceride/cholesterol ratios in lipoproteins compared with other calculation methods. Clin Chem 1988;34(12):2532-4.
12. Hattori Y, Suzuki M, Tsushima M, Yoshida M, Tokunaga Y, Wang Y, et al. Development of approximate formula for LDL-chol, LDL-apo B and LDL-chol/LDL-apo B as indices of hyperapobetalipoproteinemia and small dense LDL. Atherosclerosis 1998;138:289-99. https://doi.org/10.1016/s0021-9150(98)00034-3
13. Puavilai W, Laoragpongse D. Is calculated LDL-C by using the new modified Friedewald equation better than the standard Friedewald equation? J Med Assoc Thai 2004;87(6):589-93.
14. Anandaraja S, Narang R, Godeswar R, Laksmy R, Talwar KK. Low-density lipoprotein cholesterol estimation by a new formula in Indian population. Int J Cardiol 2005;102(1):117-20. https://doi.org/10.1016/j.ijcard.2004.05.009
15. Teerakanchana T, Puavilai W, Suriyaprom K, Tungtrongchitr R. Comparative study of LDL-cholesterol levels in Thai patients by the direct method and using the Friedewald formula. Southeast Asian J Trop Med Public Health 2007;38(3):519-27.
16. Chen Y, Zhang X, Pan B, Jin X, Yao H, Chen B, et al. A modified formula for calculating low-density lipoprotein cholesterol values. Lipids Health Dis 2010;9:52. https://doi.org/10.1186/1476-511x-9-52
17. de Cordova CMM, de Cordova MM. A new accurate, simple formula for LDL-cholesterol estimation based on directly measured blood lipids from a large cohort. Ann Clin Biochem 2013;50:13-9. https://doi.org/10.1258/acb.2012.011259
18. Martin SS, Blaha MJ, Elshazly MB, Toth PP, Kwiterovich PO, Blumenthal RS, et al. Comparison of a novel method vs the Friedewald equation for estimating low-density lipoprotein cholesterol levels from the standard lipid profile. JAMA 2013;310:2061-8. https://doi.org/10.1001/jama.2013.280532
19. Bauer F, Seibert FS, Rohn B, Babel N, Westhoff TH. Estimation of LDL cholesterol in chronic kidney disease. Eur J Prev Cardiol 2021;28(12):1402-8. https://doi.org/10.1093/eurjpc/zwaa003
20. Khan M, Ain QT, Nawaz A, Iqbal Khan M, Sadiq F. Indirect calculation of LDL using thirteen equations in Pakistani population. Clin Chim Acta 2022;536:77-85. https://doi.org/10.1016/j.cca.2022.09.010
21. Dar GM, Dash M, Mahajan B. Teerakanchana’s equation transcends over 12 other LDL-C quantification formulae in the North Indian population. Clin Chim Acta 2022;531:168-76. https://doi.org/10.1016/j.cca.2022.04.006
22. Pilia G, Chen WM, Scuteri A, Orrú M, Albai G, Dei M, et al. Heritability of cardiovascular and personality traits in 6,148 Sardinians. PLoS Genet 2006;2(8):e132. https://doi.org/10.1371/journal.pgen.0020132
23. Khan SH, Niazi NK, Sobia F, Fazal N, Manzoor SM, Nadeem A. Friedewald’s equation for calculating LDL-cholesterol: Is it the time to say “Goodbye” and adopt direct LDL cholesterol methods? Pak J Med Sci 2019;35(2):388-93. https://doi.org/10.12669/pjms.35.2.679
24. Martin SS, Blaha MJ, Elshazly MB, Toth PP, Kwiterovich PO, Blumenthal RS, et al. Comparison of a novel method vs the Friedewald equation for estimating low-density lipoprotein cholesterol levels from the standard lipid profile. JAMA 2013;310(19):2061-8. https://doi.org/10.1001/jama.2013.280532
25. Grundy SM, Stone NJ, Bailey AL, Beam C, Birtcher KK, Blumenthal RS, et al. 2018 AHA/ACC/AACVPR/AAPA/ABC/ACPM/ADA/AGS/APhA/ASPC/NLA/PCNA Guideline on the Management of Blood Cholesterol: A Report of the American College of Cardiology/American Heart Association Task Force on Clinical Practice Guidelines. J Am Coll Cardiol 2019;73(24):e285-350. https://doi.org/10.1016/j.jacc.2018.11.003
26. Cicero AFG, Fogacci F, Patrono D, Mancini R, Ramazzotti E, Borghi C, et al. Application of the Sampson equation to estimate LDL-C in children: Comparison with LDL direct measurement and Friedewald equation in the BLIP study. Nutr Metab Cardiovasc Dis 2021;31(6):1911-5. https://doi.org/10.1016/j.numecd.2021.02.034
27. Piani F, Cicero AFG, Ventura F, Dormi A, Fogacci F, Patrono D, et al. Evaluation of twelve formulas for LDL-C estimation in a large, blinded, random Italian population. Int J Cardiol 2021;330:221-7. https://doi.org/10.1016/j.ijcard.2021.02.009
28. Steyn N, Muller Rossouw H, Pillay TS, Martins J. Comparability of calculated LDL-C with directly measured LDL-C in selected paediatric and adult cohorts. Clin Chim Acta 2022;537:158-66. https://doi.org/10.1016/j.cca.2022.10.003
29. Dudi P, Vishwajeet, Yadav SRM, Sharma P, Kumar P, Mirza AA, et al. Derivation of a Modified Friedewald’s equation for LDL cholesterol estimation in Sub-Himalayan population: A comparative study. J Family Med Prim Care 2022;11(5):1826. https://doi.org/10.4103/jfmpc.jfmpc_1063_21
30. Chowdhury N, Saiedullah M, Khan MAH, Rahman MR. Comparison of modified Friedewald’s formula with direct measurement of low-density lipoprotein cholesterol in Bangladeshi population. Bangladesh Med Res Counc Bull 2013;39(3):120-3. https://doi.org/10.3329/bmrcb.v39i3.20312
31. Frank ATH, Zhao B, Jose PO, Azar KMJ, Fortmann SP, Palaniappan LP. Racial/Ethnic Differences in Dyslipidemia Patterns. Circulation 2014;129(5):570-9. https://doi.org/10.1161/circulationaha.113.005757
|
Following author have made substantial contributions to the manuscript as under:
AN, MK: Analysis and interpretation of data, drafting the manuscript, approval of the final version to be published QA, HB & MDK: Acquisition of data, drafting the manuscript, approval of the final version to be published MIK: Concept and study design, critical review, approval of the final version to be published FS: Concept and study design, acquisition of data, critical review, approval of the final version to be published Author agree to be accountable for all aspects of the work in ensuring that questions related to the accuracy or integrity of any part of the work are appropriately investigated and resolved. |
|
CONFLICT OF INTEREST Authors declared no conflict of interest, whether financial or otherwise, that could influence the integrity, objectivity, or validity of their research work.
GRANT SUPPORT AND FINANCIAL DISCLOSURE Author declared no specific grant for this research from any funding agency in the public, commercial or non-profit sectors |
|
DATA SHARING STATEMENT The data that support the findings of this study are available from the corresponding author upon reasonable request |
|
|
|
KMUJ web address: www.kmuj.kmu.edu.pk Email address: kmuj@kmu.edu.pk |