 https://doi.org/10.35845/kmuj.2024.23434 ORIGINAL ARTICLE
Epidermal growth factor receptor immuno-expression in malignant epithelial ovarian tumors
Sidra Maqbool
Khan ![]() 1,2, Asif Ali
1,2, Asif Ali ![]() 1,3, Shagufta Naeem 4, Shabana Naz 4 ,
1,3, Shagufta Naeem 4, Shabana Naz 4 ,
Hamza Javed ![]() 5
5
|
1: Institute of Pathology and Diagnostic Medicine, Khyber Medical University, Peshawar, Pakistan. 2: Department of Pathology, Woman Medical and Dental College, Abbottabad, Pakistan 3: Department of Radiology, Ayub Teaching Hospital, Abbottabad, Pakistan 4 : Department of Pathology, Ayub Medical College, Abbottabad, Pakistan
Email
Contact #: +92-333-9929282
Date Submitted: August 02, 2023 Date Revised: May 21, 2024 Date Accepted: May 27, 2024 |
|
THIS ARTICLE MAY BE CITED AS: Khan SM, Ali A, Naeem S, Naz S, Javed H. Epidermal growth factor receptor immuno-expression in malignant epithelial ovarian tumors. Khyber Med Univ J 2024;16(2):159-64. https://doi.org/10.35845/kmuj.2024.23434 |
ABSTRACT
OBJECTIVE: To investigate the expression of epidermal growth factor receptor (EGFR) in surface epithelial ovarian cancers (EOCs) among the local population, considering its potential role as a therapeutic target in ovarian cancer treatment.
METHODS: This cross-sectional study was conducted at Ayub Medical College, Abbottabad, and Khyber Medical University Peshawar, Pakistan, from July 1st to December 31st 2022. Data from 73 patients diagnosed with EOC were collected using consecutive sampling. Inclusion criteria required histopathological confirmation of EOC and sufficient biopsy specimens for immune-histochemical (IHC) analysis. Patients who declined participation or lacked adequate biopsy samples for IHC were excluded. Biopsy samples were histologically confirmed for EOC, and IHC staining was performed to detect EGFR-1 protein, validated with positive and negative controls.
RESULTS: The mean age of the participants was 53.42±9.99 years, with serous type lesions being the most prevalent (n=40, 54.8%). EGFR expression varied, with 46.6% showing moderate positivity, 27.4% and 19.2% cases demonstrating weak and strong positivity respectively. Significant differences in EGFR positivity were noted between lesion types (p=0.002) and among patients with positive vs. negative family histories (p=0.001). No significant associations were found with parity or socioeconomic status. ANOVA analysis revealed no significant differences in age, age at menarche, or age at menopause based on EGFR positivity levels (p > 0.05).
CONCLUSIONS: A moderate to high intensity level of EGFR expression in cases of serous cyst adenocarcinomas and patients with family history of reproductive system malignancy suggest its potential as a therapeutic target for ovarian cancer treatment in such patients.
KEYWORDS:Ovarian Neoplasms (MeSH);Surface epithelial ovarian cancer (Non-MeSH);EGF Family of Proteins (MeSH); ErbB Receptors (MeSH); Epidermal Growth Factor Receptor (MeSH); Immunohistochemistry (MeSH).
INTRODUCTION
Cancer is a global health issue, causing the deaths of nearly 10 million people in 2020.1 Among the cancers affecting women, breast, ovarian, and cervical cancers are prominent.2 Ovarian cancer, ranking as the seventh most common cancer in women, contributes to 4.4% of all cancer-related deaths in females.3 In 2020 alone, it led to the deaths of approximately 207,252 individuals, representing 2.1% of all cancer-related fatalities. 1 Alarmingly, estimates suggest that the incidence of ovarian cancer is rising, with projections indicating a 47% increase by 2040 compared to 2020.1 In Pakistan, it is particularly prevalent,4 ranking as the fifth most common cancer among women, affecting 4.8% of the female population in the region. 5 This underscores the urgent need for continued research, awareness, and improved healthcare strategies to combat this deadly disease effectively.
Primary ovarian tumors encompass various types, such as epithelial ovarian cancers (EOCs), germ-cell tumors, sex-cord stromal tumors, and other less common subtypes.6 EOCs, which originate from the mesothelial lining of the ovaries, constitute nearly 90% of all ovarian cancer cases. They are further categorized into five histopathological subtypes: endometrioid, brenner, serous, mucinous, and clear cell. Serous EOCs account for approximately 80% of observed cases, with endometrioid EOCs making up about 10%.7 The typical age of onset for epithelial ovarian cancers is around 63 years.
The overexpression of epidermal growth factor receptor (EGFR) is prevalent in a substantial number of ovarian carcinoma cases, reported between 40% and 90%.6,8 This dysregulation of EGFR-1 expression plays a critical role in the development, progression, and resistance to treatment in diverse cancers, including ovarian cancer.9 Therefore, targeted therapeutic strategies such as anti-EGFR monoclonal antibodies are being explored for their potential to mitigate ovarian malignancies.9 Recent studies demonstrated the promising outcomes of EGFR-1 targeted therapies in various cancers like colorectal cancer, non-small cell lung cancer, and head and neck squamous cell carcinoma.10
There is limited specific data regarding EGFR expression in ovarian epithelial cancer within the population under study. This study seeks to investigate whether EGFR-1 expression levels in ovarian epithelial cancers correlate with clinicopathological parameters such as tumor histological subtype and patient sociodemographics. Identifying such associations could potentially establish EGFR-1 as both a prognostic biomarker and a therapeutic target in ovarian cancer. Therefore, our research focuses on investigating EGFR expression levels specifically in EOCs within our community.
METHODS
This cross-sectional study was conducted from July to December 2022 at the Institute of Pathology and Diagnostic Medicine (IPDM), Khyber Medical University Peshawar, and the Pathology Department of Ayub Medical College Abbottabad, Pakistan. The sample size comprised 73 patients, determined using the WHO sample size calculation formula with a confidence level of 95%, an estimated prevalence of EGFR expression in ovarian cancer at 70%, and a desired precision of 18%.6 Consecutive sampling was utilized for participant selection. Inclusion criteria encompassed patients diagnosed with EOC based on histopathology, with adequate biopsy specimens available for subsequent IHC analysis. Biopsy specimens of EOCs with complete clinical histories and sufficient tissue blocks for IHC staining were also included. Patients lacking adequate biopsy specimens for immune-histochemical (IHC) analysis were excluded from the study.
The study commenced following approval from the Advanced Studies & Research Board and the Ethical Board of Khyber Medical University, Peshawar (KMU/IPDM/IEC/2022/15 dated 15-06-2022).
Data collection involved obtaining informed consent from patients and gathering demographic information using a structured questionnaire developed for this purpose. Biopsy samples diagnosed as EOC were processed and verified at the pathology department of Ayub Medical College Abbottabad. Sections of 4µm thickness were cut using the Shandon™ Finesse™ 325 Manual Microtome, a microtome manufactured in China, and then transported to the IPDM lab for immune-histochemical staining to detect EGFR-1 protein expression. Malignant cells originating from the ovarian mesothelium, exhibiting characteristics such as nuclear stratification, hyperchromatic pleomorphic nuclei, atypical mitotic figures, and infiltrative growth into the ovarian stroma with stromal reaction, were classified as malignant epithelial ovarian tumors.7
The immunohistochemistry (IHC) optimization process was meticulously planned to ensure both specificity and reproducibility. Initially, sections underwent a 5-minute treatment with a peroxidase blocker to prevent nonspecific binding of antibodies. This crucial step aimed to minimize background staining and improve the clarity of the immunohistochemical signals. Subsequently, sections were extensively rinsed with tris-buffered saline (TBS) wash buffer solution to eliminate any residual blocker.
The primary antibody used was a rabbit monoclonal IgG anti-human EGFR antibody derived from the EP11 clone (Dako, catalogue # BSB 6718), chosen for its strong specificity and affinity towards the EGFR protein. Sections were incubated with the primary antibody for 30 to 60 minutes at room temperature to facilitate optimal binding to the target antigen. Following incubation, the sections were rinsed again with TBS to remove any unbound antibodies.
For the detection of the primary antibody binding, a two-step detection process was utilized. Initially, a labeled polymer was applied for 10 minutes to bind with the primary antibody. Subsequently, the sections were rinsed with TBS. In the second detection step, a substrate-chromogen solution was applied for 10 minutes. This solution reacts with the enzyme label, generating a colorimetric reaction visible under a microscope. After each detection step, thorough rinsing with TBS was performed to eliminate any excess reagents.
After completing the detection steps, the substrate or chromogen necessary for visual signal generation was applied to the sections for 5 to 10 minutes. This step was crucial for developing the final visible stain indicating EGFR protein expression. Following chromogen development, sections were briefly exposed to hematoxylin for 1 minute as a counterstain, which stains cell nuclei and enhances contrast for visualizing the protein of interest. Subsequently, sections underwent another round of rinsing with TBS to remove excess hematoxylin. Finally, a cover slip was carefully placed over the sections to prepare them for microscopic examination. Throughout the process, validation was ensured with negative controls (oral mucosa samples omitting the primary antibody) and positive controls (lung adenocarcinoma samples with known EGFR expression levels), ensuring the accuracy and reliability of the staining procedure.
The intensity of EGFR expression in IHC staining was semi-quantitatively scored as follows: 0 indicated no staining; 1+ indicated faint cytoplasmic staining visible in more than 10% of cells; 2+ indicated moderate membranous staining visible in 10% to 20% of cells; and 3+ indicated strong membranous staining visible in more than 20% of cells. This scoring system, based on established protocols,11,12 enables comparative analysis and quantitative assessment of staining intensity. For examination of the slides, the Olympus CX 23 microscope, manufactured in China, was utilized, providing sufficient optical clarity and magnification to accurately assess the staining results.
Data analysis was performed using SPSS v25 software. Descriptive statistics such as mean and standard deviation were computed for continuous variables, while frequency and percentages were calculated for categorical variables to assess their distribution among the study population. The chi-square and ANOVA tests were employed where applicable to examine the correlation between EGFR-1 protein expression strength in EOCs and the variables under investigation. A significance level of 5% (p ≤ 0.05) was used to determine statistically significant relationships. The study results were presented using tables and graphs to enhance clarity and facilitate interpretation.
RESULTS
The patients had a mean age of 53.42 ± 9.99 years, ranging from 26 to 74 years. The youngest patient, aged 26 years, was diagnosed with unilateral mucinous carcinoma and exhibited moderate EGFR expression. On average, patients experienced menarche at 11.84±0.7577 years, with the age at menarche ranging from 11 to 13 years. The mean age at menopause was 49.27±3.55 years, with menopause occurring between 40 and 59 years of age. The youngest woman reached menopause at 40 years due to premature ovarian failure induced by hormonal treatments. According to laboratory reports, EGFR expression was absent in 5 out of 73 specimens (6.8%), which were thus categorized as negative. Moderate EGFR expression was observed in 34 out of 73 specimens (46.6%). These findings, along with sociodemographic and clinical features, are detailed in Table 1.
Table I: Descriptive statistics of the sociodemographic and clinical characteristics of patients with Ovarian Epithelial Cancer
|
Parameters |
Frequency |
Percentage |
|
|
Parity |
Nullipara |
8 |
11.0 |
|
Para 1-Para 3 |
16 |
21.9 |
|
|
Multipara |
49 |
67.1 |
|
|
Family History of Reproductive system Cancer |
Negative |
39 |
53.4 |
|
Positive |
34 |
46.6 |
|
|
Laterality of lesion |
Unilateral |
67 |
91.8 |
|
Bilateral |
6 |
8.2 |
|
|
Socioeconomic Class |
Lower class |
33 |
45.2 |
|
Lower Middle class |
32 |
43.8 |
|
|
Middle class |
7 |
9.6 |
|
|
Upper middle class |
1 |
1.4 |
|
|
Type of lesion on Histopthology |
Serous |
40 |
54.8 |
|
Mucinous |
19 |
26.0 |
|
|
Endometrioid |
8 |
11.0 |
|
|
Clear cell Carcinoma |
6 |
8.2 |
|
|
EGFR positivity on immuno-histochemical analysis
|
Negative |
5 |
6.8 |
|
Weak Positive |
34 |
46.6 |
|
|
Moderate Positive |
20 |
27.4 |
|
|
Strong Positive |
14 |
19.2 |
|
Table II presents the intensity of EGFR positivity in patients with EOC, categorized by lesion type, family history of female reproductive system malignancies, parity, and socioeconomic status. Significant differences in EGFR positivity intensity were observed between lesion types (p =0.002) and between patients with positive and negative family histories of female reproductive system malignancies (p =0.001). However, no significant differences were found in EGFR positivity intensity between patients with different parity (p =0.562) or different socioeconomic statuses (p =0.495). These findings suggest that patients with a positive family history or serous lesions may exhibit higher levels of EGFR expression. Further studies are necessary to validate these conclusions.
Table II: Correlation between intensity of egfr positivity on immune-histochemical and clinicopathological parameters
|
Parameters |
Intensity of EGFR positivity on IHC |
Chi-Square Test P-value |
||||
|
Negative (n=5) |
Weak (n=20) |
Moderate (n=34) |
Strong (n=14) |
|||
|
Type of lesion |
Serous |
1 |
4 |
23 |
12 |
p = 0.002 |
|
Mucinous |
3 |
11 |
3 |
2 |
||
|
Endometriod |
1 |
3 |
4 |
0 |
||
|
Clear cell Ca |
0 |
2 |
4 |
0 |
||
|
Family History |
Negative |
3 |
17 |
17 |
2 |
p = 0.001 |
|
Positive |
2 |
3 |
17 |
12 |
||
|
Socioeconimic Class |
Lower class |
2 |
2 |
1 |
7 |
p = 0.495 |
|
Lower middle |
2 |
7 |
0 |
6 |
||
|
Middle class |
1 |
17 |
5 |
1 |
||
|
Upper middle |
0 |
6 |
1 |
0 |
||
|
Parity |
Nulliparou |
0 |
1 |
4 |
3 |
p = 0.562 |
|
Parity 1-3 |
1 |
6 |
8 |
1 |
||
|
Multipara |
4 |
13 |
22 |
10 |
||
IHC=immunohistochemistry; EGFR= epidermal growth factor receptor
Table III presents the relationship between intensity of EGFR positivity on IHC and patient various age variables like mean age, age at menarche, and age at menopause across four groups categorized by intensity levels of EGFR positivity on IHC analysis.The ANOVA results indicate no statistically significant differences in mean age (p=0.275), age at menarche (p=0.592), or age at menopause (p=0.427) between these groups.
Table III: Relationship between intensity of EGFR positivity on IHC and patient age
|
Parameters |
Intensity of EGFR positivity on IHC |
ANOVA Test |
|||
|
Negative (n=5) |
Weak (n=20) |
Moderate (n=34) |
Strong (n=14) |
||
|
Age (Years) |
51.80 ± 6.06 |
57.17± 9.06 |
52.29± 9.95 |
51.43 ± 11.85 |
P = 0. 275 |
|
Age at Menarche (Years) |
12.20 ± 0.84 |
11.95± 0.83 |
11.76± 0.74 |
11.79 ± 0.67 |
P = 0.592 |
|
Age at Menopause (Years) |
50.00 ± 1.16 |
50.12± 3.60 |
48.48± 3.51 |
49.89 ± 4.17 |
P = 0.427 |
IHC=immunohistochemistry; EGFR= epidermal growth factor receptor
Table III shows the results of an ANOVA test on the intensity of EGFR positivity on IHC in the four groups.
Figure 1 presents a grid of images showing slides demonstrating various intensity levels of EGFR positivity. Images A, B, and C illustrate severe, moderate, and low uptake of anti-EGFR antibody, respectively.
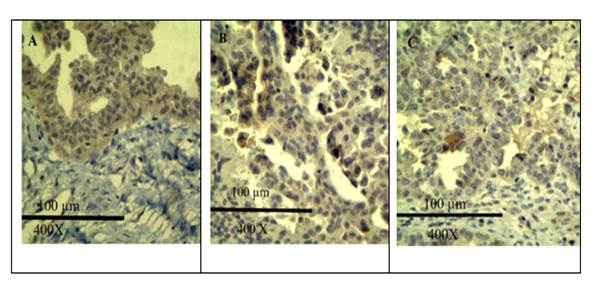
Figure 1: Micrographs with scale bar and magnification from our study showing IHC stain (anti-EGFR antibody) uptake at different intensity levels (Picture A, B and C shows severe, moderate and weak intensity anti-EGFR antibody uptake respectively)
DISCUSSION
Our study found that 46.6% of patients diagnosed with EOC displayed moderate to high levels of EGFR expression. This elevated expression was particularly prominent in serous cyst adenocarcinomas and among patients with a familial history of female reproductive system malignancies, suggesting that EGFR could be a promising therapeutic target in these cases. We also noted significant variability in EGFR expression across different subtypes of EOC, with serous carcinomas showing the highest levels of expression (p = 0.002). Interestingly, our study revealed no significant association between EGFR expression and the age, parity, or socioeconomic status of the patients. These observations are critical as they suggest that while EGFR is a promising target for therapeutic intervention, its expression is independent of these demographic factors.
Our findings are consistent with prior research indicating variable EGFR expression across different subtypes of ovarian cancer. For instance, studies by Cirstea AE, et al., have shown higher EGFR expression in serous carcinomas compared to mucinous tumors, aligning with our observation of increased positivity in serous lesions.13 Brustmann reported EGFR positivity in 64% of serous carcinomas.14 Another study highlighted significantly elevated EGFR cytoplasmic positivity in ovarian borderline tumors and carcinomas compared to normal ovarian tissue and benign tumors. 15 However, our results differ from Fujiwara S, et al., who reported lower EGFR positivity (39.3%) in serous carcinomas.16 This disparity may stem from regional genetic variations or differences in detection methods, emphasizing the necessity for standardized EGFR assessment protocols across studies.
Furthermore, our findings build upon the work of Skrnisdóttir I, et al., and Nielsen JS, et al., who explored the correlation of EGFR and Human Epidermal Growth Factor Receptor 2 (HER2)/neu expression with clinicopathological factors. Our study suggests that while EGFR is frequently overexpressed, it does not correlate with traditional prognostic markers such as age or parity.17,18
Skrnisdóttir I et al. investigated EGFR and HER2/neu expression in early-stage ovarian carcinomas and found no correlation between their expression and clinicopathological predictive factors.17 They concluded that EGFR and tumor grade are independent variables, noting a higher prevalence of EGFR/HER2/neu co-expression in serous ovarian carcinoma.
In a comprehensive study involving 783 ovarian malignant surface tumors, Nielsen JS et al. reported overexpression of HER2/neu in 35% and EGFR in 62% of cases.18 They observed no additional association between HER2/neu expression and clinical stage or prognostic variables such as age, tumor size, or FIGO stage. However, they did find a correlation between HER2/neu expression and tumor grade.19, 20
The strong correlation between EGFR expression and certain ovarian cancer subtypes as well as family history not only supports its potential as a prognostic biomarker but also emphasizes its role in targeted therapeutic approaches.Recognizing the expression patterns of EGFR in EOC can facilitate the development of precision medicine strategies, potentially enhancing treatment outcomes for patients exhibiting elevated EGFR levels.
Limitations and Opportunities for Future Research:
Our study offers valuable insights but is limited by its cross-sectional design and small sample size, which may affect the generalizability of our findings. The lack of significant associations between EGFR expression and demographic characteristics underscores the need for larger, longitudinal studies to confirm these results. Future research should aim to elucidate the mechanisms behind EGFR expression variability and its role in treatment resistance and disease progression.
Further investigations should evaluate the long-term efficacy of EGFR-targeted therapies and explore genetic and molecular profiles that influence treatment outcomes. Understanding resistance mechanisms to EGFR inhibitors is essential for developing effective second-line therapies for non-responders. Integrating genomic data is crucial for optimizing precision therapy in epithelial ovarian cancer (EOC), advancing personalized treatment approaches.
Conclusion
Our study highlights the moderate to high expression of EGFR in serous cyst adenocarcinomas and among patients with a familial history of reproductive cancers, suggesting that EGFR-targeted therapies may offer significant benefits to these specific groups. These findings advocate for the integration of EGFR expression profiling into routine diagnostic and therapeutic protocols for ovarian cancer.
REFERENCES
1. Sung H, Ferlay J, Siegel RL, Laversanne M, Soerjomataram I, Jemal A, Bray F. Global cancer statistics 2020: GLOBOCAN estimates of incidence and mortality worldwide for 36 cancers in 185 countries. CA Cancer J Clin 2021;71(3):209-49. https://doi.org/10.3322/caac.21660
2. Momenimovahed Z, Tiznobaik A, Taheri S, Salehiniya H. Ovarian cancer in the world: epidemiology and risk factors. Int J Womens Health 2019;11:287. https://doi.org/10.2147/IJWH.S197604
3. Jessmon P, Boulanger T, Zhou W, Patwardhan P. Epidemiology and treatment patterns of epithelial ovarian cancer. Expert Rev Anticancer Ther 2017;17(5):427-37. https://doi.org/10.1080/14737140.2017.1299575
4. Cheema MK, Nadeem A, Khan SA, Sarfraz T, Intikhab K, Shahzad T. Evaluation of histo-pathological patterns of ovarian masses in relation to age in Rawalpindi-Islamabad region - Lab Research. J Pak Med Assoc 2019;69(2):285-9.
5. Global Health Estimates: Leading Causes of Death [Internet]. World Health Organization. World Health Organization; [Accessed On: January 26, 2023]. Available from URL: https://www.who.int/data/gho/data/themes/mortality-and-global-health-estimates/ghe-leading-causes-of-death
6. Coburn SB, Bray F, Sherman ME, Trabert B. International patterns and trends in ovarian cancer incidence, overall and by histologic subtype. Int J Cancer 2017;140(11):2451-60. https://doi.org/10.1002/ijc.30676
7. Kumar V, Abbas AK, Fausto N, Aster JC. Robbins and Cotran Pathologic Basis of disease. 10th ed. Philadelphia: Elsevier Saunders; 2018.
8. Harrison PT, Vyse S, Huang PH. Rare epidermal growth factor receptor (EGFR) mutations in non-small cell lung cancer. Semin Cancer Biol 2020;61:167-79. https://doi.org/10.1016/j.semcancer.2019.09.015
9. Sharifi J, Khirehgesh MR, Safari F, Akbari B. EGFR and anti-EGFR nanobodies: review and update. J Drug Target 2021;29(4):387-402. https://doi.org/10.1080/1061186X.2020.1853756
10. Asante DB, Calapre L, Ziman M, Meniawy TM, Gray ES. Liquid biopsy in ovarian cancer using circulating tumor DNA and cells: ready for prime time? Cancer Lett 2020;468:59-71. https://doi.org/10.1016/j.canlet.2019.10.014
11. Yu J, Kane S, Wu J, Benedettini E, Li D, Reeves C, et al. Mutation-specific antibodies for the detection of EGFR mutations in non-small-cell lung cancer. Clin Cancer Res 2009;15(9):3023-8. https://doi.org/10.1158/1078-0432.CCR-08-2739
12. Wen YH, Brogi E, Hasanovic A, Ladanyi M, Soslow RA, Chitale D, et al. Immunohistochemical staining with EGFR mutation-specific antibodies: high specificity as a diagnostic marker for lung adenocarcinoma. Mod Pathol 2013;26(9):1197-1203. https://doi.org/10.1038/modpathol.2013.53
13. Cirstea AE, Stepan AE, Zavoi RE, Simionescu CE. EGFR immunoexpression in malignant serous and mucinous ovarian tumors. Curr Health Sci J 2018;44(2):129. https://doi.org/10.12865/CHSJ.44.02.06
14. Brustmann H. Epidermal growth factor receptor expression in serous ovarian carcinoma: an immunohistochemical study with galectin-3 and cyclin D1 and outcome. Int J Gynecol Pathol 2008;27(3):380-9. https://doi.org/10.1097/PGP.0b013e31815d060d
15. Chen AP, Zhang J, Liu H, Zhao SP, Dai SZ, Sun XL. [Association of EGFR expression with angiogenesis and chemoresistance in ovarian carcinoma]. Zhonghua Zhong liu za zhi [Chinese Journal of Oncology]. 2009;31(1):48-52.
16. Fujiwara S, Terai Y, Kawaguchi H, Takai M, Yoo S, Tanaka T, et al. GPR30 regulates the EGFR-Akt cascade and predicts lower survival in patients with ovarian cancer. J Ovarian Res 2012;5(1):35. https://doi.org/10.1186/1757-2215-5-35.
17. Skirnisdóttir I, Sorbe B, Seidal T. The growth factor receptors HER-2/neu and EGFR, their relationship, and their effects on the prognosis in early stage (FIGO I-II) epithelial ovarian carcinoma. Int J Gynecol Cancer 2001;11(2). https://doi.org/10.1136/ijgc-00009577-200103000-00005
18. Nielsen JS, Jakobsen E, Hølund B, Bertelsen K, Jakobsen A. Prognostic significance of p53, Her-2, and EGFR overexpression in borderline and epithelial ovarian cancer. Int J Gynecol Cancer 2004;14(6). https://doi.org/10.1136/ijgc-00009577-200411000-00005
19. Marinaş MC, Mogoş G, Ciurea R, Mogoş DG. EGFR, HER2/neu, and Ki67 immunoexpression in serous ovarian tumors. Rom J Morphol Embryol 2012;53(3):563-567.
20. Braem MG, Onland-Moret NC, Van Den Brandt PA, Goldbohm RA, Peeters PH, Kruitwagen RF, et al. Reproductive and hormonal factors in association with ovarian cancer in the Netherlands cohort study. Am J Epidemiol 2010;172(10):1181-9. https://doi.org/10.1093/aje/kwq264.
|
CONFLICT OF INTEREST Authors declared no conflict of interest, whether financial or otherwise, that could influence the integrity, objectivity, or validity of their research work. GRANT SUPPORT AND FINANCIAL DISCLOSURE Authors declared no specific grant for this research from any funding agency in the public, commercial or non-profit sectors |
|
DATA SHARING STATEMENT The data that support the findings of this study are available from the corresponding author upon reasonable request |
|
|
|
KMUJ web address: www.kmuj.kmu.edu.pk Email address: kmuj@kmu.edu.pk |