![]() https://doi.org/10.35845/kmuj.2023.23301
ORIGINAL
ARTICLE
https://doi.org/10.35845/kmuj.2023.23301
ORIGINAL
ARTICLE
Correlation between lateral cephalometric and facial photographic measurements for orthodontic diagnosis in patients with mandibular deficiency
Shahzonia Tariq1
![]() , Nazish Amjad 1,
Muhammad Hasnain1, Ayesha Shafiq1,2, Asma NajibUllah Khan3,
Haseeb Alam Zeb1
, Nazish Amjad 1,
Muhammad Hasnain1, Ayesha Shafiq1,2, Asma NajibUllah Khan3,
Haseeb Alam Zeb1
|
1: Department of Orthodontics, Dental College, HITEC-Institute of Medical Sciences (HITEC-IMS), Taxila, Pakistan 2: Department of Orthodontics, Shifa College of Dentistry, Islamabad, Pakistan 3: Dental Department, Pakistan Atomic Energy Commission (PAEC) General Hospital, Islamabad, Pakistan
Email
Contact #: +92-332-5101991 Date Submitted: January 10, 2023 Date Revised: November 21, 2023 Date Accepted: November 27, 2023 |
|
THIS ARTICLE MAY BE CITED AS: Tariq S, Amjad N, Hasnain M, Shafiq A, Khan AN, Zeb HA. Correlation between lateral cephalometric and facial photographic measurements for orthodontic diagnosis in patients with mandibular deficiency. Khyber Med Univ J 2023;15(4):254-7. https://doi.org/10.35845/kmuj.2023.23301 |
ABSTRACT
OBJECTIVE: To correlate lateral cephalometric and facial photographic measurements for orthodontic diagnosis in patients with mandibular deficiency.
METHODS: This descriptive cross-sectional study was conducted at Department of Orthodontics, Dental College HITEC-IMS Taxila, Pakistan from Feb 2022 to July 2022. Total 60 patients were selected with the age range of 15-30 years. All selected patients underwent lateral cephalometric radiography in natural head position. These radiographs were manually traced to measure SNB (sella, nasion, B point) and MCL (Mandibular Corpus Length). Facial photographs were taken for Ḿ-Mé (Distance between soft tissue menton and point M’) and TŃ B́ (Angular measurement showing anteroposterior position of mandible) measurements. Using SPSS 20.0, Pearson Correlation ‘r’ assessed the correlation between lateral cephalogram and facial photographs, with a significant P value of ≤ 0.05 considered.
RESULTS: In this study involving 60 patients (26 males, 34 females) with an average age of 21±5.37 years, a statistically significant correlation was observed between facial photographic and lateral cephalometric measurements for orthodontic diagnosis in patients with mandibular deficiency. The Pearson correlation coefficient of SNB and TŃ B́ was 0.788, indicating a high positive correlation. Additionally, the Pearson correlation coefficient of MCL and Ḿ-Mé was 0.571, demonstrating a substantial positive correlation.
CONCLUSION: This study demonstrates a significant correlation between facial photographic and lateral cephalometric measurements in diagnosing mandibular deficiency, suggesting facial photographs' reliability as an alternative to lateral cephalograms in evaluating craniofacial morphology in patients with mandibular deficiency.
KEYWORDS: Cephalometry (MeSH); Lateral cephalometric (Non-MeSH); Photography (MeSH); Facial photography (Non-MeSH); Orthodontic diagnosis (Non-MeSH); Mandibular deficiency (Non-MeSH); Natural head position (Non-MeSH).
INTRODUCTION
Orthodontists emphasize attaining facial harmony and balance, employing diagnostic tools such as clinical examinations, dental casts, photographs (intraoral and extraoral), and various radiographs, with lateral cephalometric radiographs holding particular significance in orthodontic diagnosis and treatment planning.1 Facial photographs, on the other hand, serve as supplementary tools in this process.
Although a cephalometric radiograph is considered a significant diagnostic tool, it has drawbacks: radiation exposure, providing a two-dimensional representation of a three-dimensional structure, and the need for special equipment (a cephalostat) that is not available everywhere.2 So the photographs gained importance due to their low cost, easy availability, no instrumental expense, and non-invasive characteristics.3-5 Therefore, this diagnostic tool may be a feasible alternative when the radiographic method is considered invasive.6
There has been a shift in orthodontics from the “angle paradigm," which focused mainly on the teeth and the jaws, to the “soft-tissue paradigm”,7 which focused on the clinical examination of a patient rather than the evaluation of the patient’s casts and radiographs to design a management plan for an orthodontic patient, which means that we should treat the malocclusion in concordance with the facial aesthetics of the patient.8
This study is prompted by the observed occasional disparities between facial photographic and lateral cephalometric diagnoses during orthodontic sessions, particularly in patients with mandibular deficiency, influencing treatment plans. The study was planned to investigate the correlation between lateral cephalometric and facial photographic measurements for orthodontic diagnosis in patients with mandibular deficiency. This exploration seeks to ascertain whether these measurements can be interchangeable or if they yield distinct diagnoses in orthodontic patients, emphasizing the need to consider each individually for comprehensive and effective treatment planning based on the patient's facial profile.
METHODS
This study was conducted at the Department of Orthodontics, Dental College HITEC-IMS Taxila, Pakistan. A total sample size of 60 patients was selected by non-probability consecutive technique using correlation calculator.
Patients with the age between 15-30 years, presented with mandibular deficiency and no history of craniofacial trauma were included in the study while the patients having any craniofacial abnormality and males having beard were excluded from this study.
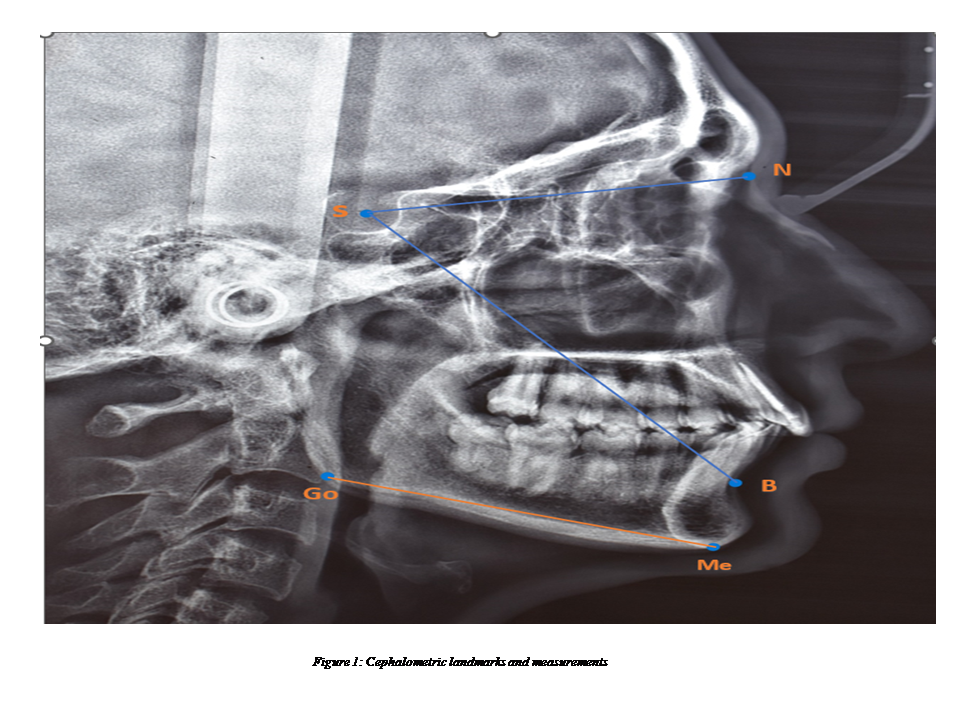
Lateral cephalometric radiographs in natural head position were taken of all the selected patients. Each radiograph underwent manual tracing on acetate paper using a 2HB Goldfish pencil, and measurements of SNB (Sella, Nasion, B point) and MCL (Mandibular Condylar Length) were subsequently calculated for all patients (Table I and Figure I).
Table I: Cephalometric landmarks and measurements
|
Name (Symbol) |
Definition |
|
|
Landmarks |
Sella (S) |
Midpoint of Sella turcica |
|
Nasion (N) |
The most anterior point of the frontonasal suture in the midsagittal plane |
|
|
B point (Supramentale) [B] |
The deepest point in the concavity between chin and mandibular alveolar process |
|
|
Gonion (Go) |
Most posteroinferior point on angle of mandible |
|
|
Menton (M) |
The most inferior point on the mandibular symphysis |
|
|
Measurements |
SNB |
Angle formed by SN plane and NB line showing anteroposterior position of mandible relative to the anterior cranial base |
|
MCL (Go-Me) |
Line joining Go to Me showing length of mandibular body in millimeters (mm) |
|
SNB: Sella, Nasion, B point; MCL: Mandibular Condylar Length
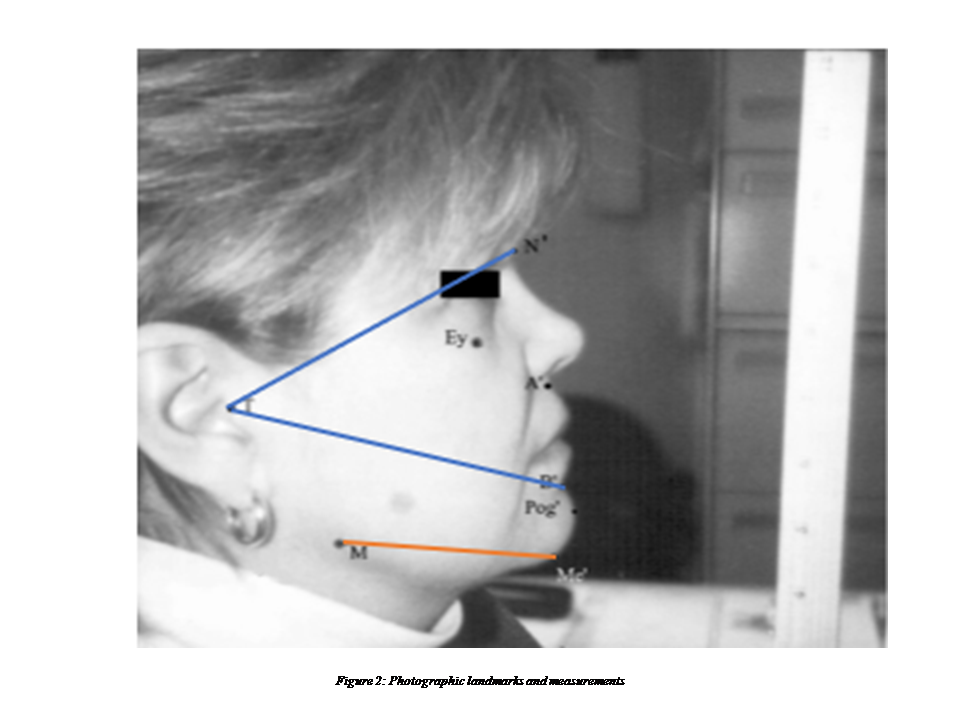
Then the facial photographs of the right lateral view were taken using a Nikon DSLR D3500 in a natural head position with maximum intercuspation, relaxed lips, and by asking the patient to look into the reflection of their eye in a mirror that was placed at eye level on a wall in front of the patient. Each subject held a ruler (12 inches) in front of the nose as a measurement scale for the resulting image we obtained. Ḿ - Mé and TŃ B́ were measured on these photographs (Table II and Figure II).
Table II: Photographic landmarks and measurements
|
Name (Symbol) |
Definition |
|
|
Landmarks |
Tragion (T) |
The point where the inner crease meets the outer edge at the center of the ear |
|
Soft tissue Nasion (N′) |
Located at the point of maximum concavity between nose and forehead |
|
|
Soft tissue point B (B′) |
Analogous to the hard tissue point B located by palpation |
|
|
Point M′ (M′) |
Analogous to the gonion of the mandible, located by palpation |
|
|
Soft tissue Menton (Me′) |
Lowest point on soft tissue of mandibular symphysis located by palpation |
|
|
Measurements |
TN′B′ |
Angle formed by TN′ plane and TB′ line showing anteroposterior position of mandible on photograph |
|
M′-Me′ |
Line joining M′ to Me′ showing mandibular length in millimeters (mm) on photograph |
|
Mandibular deficiency was defined on the lateral cephalogram as SNB of the patient less than 78⁰ and MCL(Go-Me) of less than SN + 7mm. while on facial photographs, if TŃ B́ was less than 78º and Ḿ - Mé was less than SN + 7mm, patient is considered to have mandibular deficiency.
The data was analyzed on SPSS 20. Qualitative variables like gender were measured as frequency and percentage. Quantitative variables like age of the patient, SNB and MCL on lateral cephalogram, and Ḿ - Mé and TŃ B́ on facial photographs were measured as mean ± SD. Pearson Correlation ‘r’ was calculated between lateral cephalogram and facial photographs. P value ≤ 0.05 was considered significant. Effect modifiers like gender was controlled through stratification. Post-stratification (Pearson correlation) was also calculated.
RESULTS
Out of 60 patients, 26 (43.3%) were males and 34 (56.7%) were females. The mean age of the patients was 21±5.37 years. Mean SNB was 73.76±1.96° and mean TŃ B́ was 71.35±1.99°. Mean MCL was 64.38±2.72 mm and mean Ḿ-Mé was 65.34±2.70 mm.
Statistically significant correlation was found between facial photographic and lateral cephalometric measurements for orthodontic diagnosis in patients with mandibular deficiency. Pearson correlation coefficient of SNB and TŃB́ was 0.784 in males and 0.792 in females, with a mean value of 0.788 (Table III). The Pearson correlation coefficient of MCL and Ḿ-Mé was 0.497 in males and 0.644 in females, with a mean of 0.571 (Table III), showing high positive correlation between photographic and lateral cephalometric measurements.
Table III: Pearson correlation with respect to the gender
|
Pearson Correlation |
Gender |
n |
Pearson Correlation |
P-Value |
|
|
SNB and TŃB́ |
Male |
26 |
0.784 |
Mean (0.788) |
0.001 |
|
Female |
34 |
0.792 |
0.001 |
||
|
Male |
26 |
0.497 |
Mean (0.571) |
0.003 |
|
|
Female |
34 |
0.644 |
0.005 |
||
SNB: Sella, Nasion, B point; TŃ B́: Distance between the Menton and the true vertical line from Nasion; MCL: Mandibular Condylar Length; Ḿ - Mé: Distance from the midpoint of the upper lip to the midpoint of the lower lip
DISCUSSION
Our study on 60 patients (43.3% males, 56.7% females) revealed significant correlations between facial photographic and lateral cephalometric measurements in diagnosing mandibular deficiency. The Pearson correlation coefficients for SNB and TŃB́ were 0.788, and for MCL and Ḿ-Mé, they were 0.571, indicating a high positive correlation across gender groups.
Lateral cephalogram has been considered a gold standard radiograph used for the diagnosis and treatment planning of an orthodontic patient. However, facial photography can be used for epidemiologic studies as it does not expose patients to harmful radiation and is also a low-cost technique.9
It was established earlier in a few studies that the angular and linear measurements used to evaluate the morphology of the face can be measured from the facial photographs constantly. The results of these studies suggests that photographs might be a beneficial and feasible alternative when radiographic techniques are considered impractical or invasive.10-12
A study confirmed the excellent reliability of utilizing facial photographs for orthodontic diagnosis, demonstrating consistent location of landmarks used to assess craniofacial morphology.13 This finding is intriguing, particularly for epidemiologic studies involving large groups, where reproducibility is crucial. Our results demonstrate that the facial photographic technique is equally reliable as lateral cephalometry, as indicated by the correlated measurements.
Interestingly, for vertical facial heights, highest correlations were found.14 Rationale for this could be that the landmarks, nasion (N) and menton (Me) used for evaluating the height of the face are not influenced by excess of soft tissue in such areas, and as a result, the soft tissue represent a good estimation of the hard tissue landmark. The results of our study show consistency with this description. Similarly, statistically significant correlations (p<0.05) were established for most of the vertical and sagittal measurements between lateral cephalometric and facial photography.15 In another study, reliability of photographs has been checked, which indicate that the photographs can be used to locate the facial landmarks. According to this study facial photographic technique was found to be cost effective, repeatable, non-invasive and a reproducible alternative when used for orthodontic diagnostic purposes.16
In this study, significant correlation was found between lateral cephalometric and facial photographic variables for orthodontic diagnosis in patients with mandibular deficiency. Pearson correlation coefficient of SNB and TŃ B́ was 0.788 and coefficient of MCL and Ḿ-Mé was 0.571, showing high positive relationship between photographic and lateral cephalometric measurements. This was similar to a previous study in which correlation between photographic and lateral cephalometric measurements was studied and coefficient between SNB and TNB was found to be 0.390.17
A similar correlation was established between the facial photographic and lateral cephalometric variables for black and white individuals, even though the thickness of the soft tissue is generally higher in black individuals. In spite of the fact that the thickness of soft tissue is higher in black individuals, this soft tissue thickness is consistent and as a result, this consistency causes a good correlation between analogous soft tissue and hard tissue landmarks.9
In contrast to our study, no correlation was found between facial and cephalometric linear and angular measurements except for nasolabial angle and that might be due to the variability of soft tissue thickness.17
In future, more studies are needed to establish the fact that the soft tissue landmarks are analogous to their hard tissue landmarks to help us in the better diagnosis and treatment planning of orthodontic patients, especially those with mandibular deficiency.
CONCLUSION
A statistically significant correlation was found between analogous lateral cephalometric and facial photographic variables, which indicates that facial photographs can be used for orthodontic diagnosis as an alternative to lateral cephalograms to evaluate the craniofacial morphology of mandibular deficient patients.
REFERENCES
1. Alqahtani JM, Alhemaid G, Alqahtani H, Abughandar A, AlSaadi RN, Algarni I, et al. Digital Diagnostics and Orthodontic Practice. J Healthcare Sci 2022;02(06):112-7. http://dx.doi.org/10.52533/JOHS.2022.2605
2. Cala A, Noar J, Petrie A, O’Neill J. A composite photographic image – could it replace a lateral cephalogram? J Orthod 2017;44(1):14-20. https://doi.org/10.1080/14653125.2016.1277316
3. Gomes LCR, Horta KOC, Jr Gandini LG, Goncalves M, Goncalves JR. Photographic assessment of cephalometric measurements. Angle Orthod 2013;83(6):1049–58. https://doi.org/10.2319/120712-925.1
4. Mehta P, Sagarkar MR, Mathew S. Photographic assessment of cephalometric measurements in skeletal class II cases: A comparative study. J Clin Diagn Res 2017;11(6):ZC60-ZC64. https://doi.org/10.7860/jcdr/2017/25042.10075
5. Mehta P, Sagarkar RM, Mathew S. Photographic assessment of cephalometric measurements in skeletal class I subjects: A comparative study. J Clin Diag Res 2017;11(6):ZC60-ZC64. https://doi.org/10.7860/jcdr/2017/25042.10075
6. Oliveira MT, Candemil A. Assessment of the correlation between cephalometric and facial analysis. J Dent Res 2013;1(1):34-40.
7. Proffit WR, Fields HW, Larson BE, Sarver DM. Contemporary Orthodontics. Sixth Edition. 2018. Elsevier, Philadelphia, USA. ISBN 9780323543873
8. Pael DP, Trivedi R. Photography versus lateral cephalogram: Role in facial diagnosis. Indian J Dent Res 2013;24(5):587-92. https://doi.org/10.4103/0970-9290.123378
9. Zhang X, Hans MG, Graham G, Kirchner HL, Redline S. Correlations between cephalometric and facial photographic measurements of craniofacial form. Am J Orthod Dentofacial Orthop 2007;131(1):67-71. https://doi.org/10.1016/j.ajodo.2005.02.033
10. Aksu M, Kaya D, Kocadereli I. Reliability of reference distances used in photogrammetry. Angle Orthod 2010;80(4):482–9. https://doi.org/10.2319/070309-372.1
11. Ozdemir ST, Sigirli D, Ercan I, Cankur NS. Photographic facial soft tissue analysis of healthy Turkish young adults: Anthropometric measurements. Aesthetic Plast Surg 2009;33(4):175–84. https://doi.org/10.1007/s00266-008-9274-z
12. Cummins DM, Bishara SE, Jakobsen JR. A computer assisted photogrammetric analysis of soft tissue changes after orthodontic treatment. Part II: Results. Am J Orthod Dentofacial Orthop 1995;108(1):38-47. https://doi.org/10.1016/s0889-5406(95)70064-1
13. Prasanna TR, Navaneethan R, Rengalakshmi S, Prasanna A. Reliability of profile photography for determining growth pattern and sagittal jaw relationship in different classes of malocclusions. Indian J Forensic Med Toxicol 2020;14(4):5955-63. https://doi.org/10.37506/ijfmt.v14i4.12534
14. Syed ST, Mahmood A, Nazir R. Is lateral cephalogram is superior to photograph in assessment of vertical facial height measurements in orthodontic treatment? A descriptive analytic study. Isra Med J 2020;12(2):77-82.
15. Shraddha K, Shailesh S, Prakash M, Robin M, Sandeep S, Rohit K. Correlation between cephalometric and facial photographic measurements of craniofacial form - A cross sectional study. Med J Clin Trials Case Stud 2020;4(3):000258. https://doi.org/10.23880/mjccs-16000258
16. Jaiswal P, Gandhi A, Gupta AR, Malik N, Singh SK, Ramesh K. Reliability of photogrammetric landmarks to the conventional cephalogram for analyzing soft-tissue landmarks in orthodontics. J Pharm Bioallied Sci 202113(Suppl 1):S171. https://doi.org/10.4103/jpbs.jpbs_634_20
17. Khan WA, Faisal SS, Hussain SS. Correlation of Craniofacial Measurements between Cephalometric Radiographs and Facial Photographs. Ann Abbasi Shaheed Hospital Karachi Med Dent Coll (ASH KM&DC) 2018;239(1):37-45.
|
Following author have made substantial contributions to the manuscript as under:
ST: Concept and study design, acquisition, analysis and interpretation of data, drafting the manuscript, approval of the final version to be published
NA, MH & HAZ: Acquisition of data, critical review, approval of the final version to be published
AS & ANK: Analysis and interpretation of data, critical review, approval of the final version to be published
Author agree to be accountable for all aspects of the work in ensuring that questions related to the accuracy or integrity of any part of the work are appropriately investigated and resolved. |
|
CONFLICT OF INTEREST Authors declared no conflict of interest, whether financial or otherwise, that could influence the integrity, objectivity, or validity of their research work.
GRANT SUPPORT AND FINANCIAL DISCLOSURE Authors declared no specific grant for this research from any funding agency in the public, commercial or non-profit sectors |
|
DATA SHARING STATEMENT The data that support the findings of this study are available from the corresponding author upon reasonable request |
|
|
|
KMUJ web address: www.kmuj.kmu.edu.pk Email address: kmuj@kmu.edu.pk |